library("foreign")
library(ggplot2)
library(ggpubr)
library(dplyr)
library(broom)
library(ggpubr)
library(tidyverse)
library(readr)
library(car)Student Performance (Multiple Linear Regression)
Multiple linear regression
Search the determinants of student perform using multiple regression analysis
Dataset information
Description:
This research was from the Kaggle. The Student Performance Dataset is a dataset designed to examine the factors influencing academic student performance. The dataset consists of 10,000 student records, with each record containing information about various predictors and a performance index.
Variables:
- Hours Studied: The total number of hours spent studying by each student.
- Previous Scores: The scores obtained by students in previous tests.
- Extracurricular Activities: Whether the student participates in extracurricular activities (Yes or No).
- Sleep Hours: The average number of hours of sleep the student had per day.
- Sample Question Papers Practiced: The number of sample question papers the student practiced.
- Performance Index: It represents the student’s academic performance and has been rounded to the nearest whole number. The index ranges from 10 to 100, where higher values indicate better performance.
Multiple Regression Analysis: Step by step
Objective: To identify the determinants of Student Performance.
Hypothesis:
- H1: Hours Studied have a direct impact on Performance Index
- H2: Previous Scores have a direct impact on Performance Index
- H3: Sample Question Papers Practiced have a direct impact on Performance Index
- H4: Sleep Hours have a direct impact on Performance Index
Steps to prove the hypothesis
A. Model Evaluation
- Regression coeficients and r-square
- Interpretation
B. Regression Model Assumtions
- Lineality between dependent variables and independent variables.
- Independence of observations: The observation from our model are independent.
- Homoscedasticity: The errors from our model have equal variance.
- Normality of Errors: The errors from our model are normally distributed.
- Multicollinality: evaluate if the IVs are redundant.
Load the packages
A. Model Evaluation
A1. Regression coeficients and r-square
Mydata <- read_csv("data/Student_Performance.csv")
summary(Mydata$Performance_Index)
Min. 1st Qu. Median Mean 3rd Qu. Max.
10.00 40.00 55.00 55.22 71.00 100.00 Hours Studied ~ Performance_Index
HoursStudied_lm <- lm(Performance_Index ~ Hours_Studied, data = Mydata)
summary(HoursStudied_lm)
Call:
lm(formula = Performance_Index ~ Hours_Studied, data = Mydata)

Residuals:
    Min      1Q  Median      3Q     Max
-37.564 -15.244  -0.152  15.529  35.756

Coefficients:
              Estimate Std. Error t value Pr(>|t|)
(Intercept)   41.37917    0.38712  106.89   <2e-16 ***
Hours_Studied  2.77306    0.06883   40.29   <2e-16 ***
---
Signif. codes:  0 '***' 0.001 '**' 0.01 '*' 0.05 '.' 0.1 ' ' 1

Residual standard error: 17.82 on 9998 degrees of freedom
Multiple R-squared:  0.1397,    Adjusted R-squared:  0.1396
F-statistic:  1623 on 1 and 9998 DF,  p-value: < 2.2e-16
Estimates:
For each additional hour of study, the student’s performance index increased by 2.77 on average. This result was statistically significant.
Coefficient of determination:
The model explains approximately 13.97% of the variability in the Performance_Index based on the hours of study.
Previous Score ~ Performance_Index
PreviousScore_lm <- lm(Performance_Index ~ Previous_Scores, data = Mydata)
summary(PreviousScore_lm)
Call:
lm(formula = Performance_Index ~ Previous_Scores, data = Mydata)

Residuals:
     Min       1Q   Median       3Q      Max
-17.7729  -6.5239  -0.0082   6.3689  19.4346

Coefficients:
                  Estimate Std. Error t value Pr(>|t|)
(Intercept)     -15.181799   0.319605   -47.5   <2e-16 ***
Previous_Scores   1.013837   0.004465   227.1   <2e-16 ***
---
Signif. codes:  0 '***' 0.001 '**' 0.01 '*' 0.05 '.' 0.1 ' ' 1

Residual standard error: 7.744 on 9998 degrees of freedom
Multiple R-squared:  0.8376,    Adjusted R-squared:  0.8376
F-statistic: 5.156e+04 on 1 and 9998 DF,  p-value: < 2.2e-16
Estimates:
For each additional point earned on past exams, the student’s performance index increased by one point on average. This result was statistically significant.
Coefficient of determination:
The model explains approximately 83.76% of the variability in the Performance_Index from the previous score.
Sample Question Papers Practiced ~ Performance_Index
Sample_Question_Papers_lm <- lm(Performance_Index ~ Sample_Question_Papers_Practiced, data = Mydata)
summary(Sample_Question_Papers_lm)
Call:
lm(formula = Performance_Index ~ Sample_Question_Papers_Practiced,
    data = Mydata)

Residuals:
    Min      1Q  Median      3Q     Max
-46.505 -15.056  -0.056  15.234  44.814

Coefficients:
                                 Estimate Std. Error t value Pr(>|t|)
(Intercept)                      53.89602    0.36194  148.91  < 2e-16 ***
Sample_Question_Papers_Practiced  0.28992    0.06695    4.33  1.5e-05 ***
---
Signif. codes:  0 '***' 0.001 '**' 0.01 '*' 0.05 '.' 0.1 ' ' 1

Residual standard error: 19.2 on 9998 degrees of freedom
Multiple R-squared:  0.001872,  Adjusted R-squared:  0.001772
F-statistic: 18.75 on 1 and 9998 DF,  p-value: 1.503e-05
Estimates:
For each additional sample exam taken, the student’s performance index increased by 0.28 on average. This result was statistically significant.
Coefficient of determination:
The model explains only 0.18% of the variability in the Performance_Index based on the number of practice exams taken.
Sleep Hours ~ Performance_Index
SleepHours_lm <- lm(Performance_Index ~ Sleep_Hours, data = Mydata)
summary(SleepHours_lm)
Call:
lm(formula = Performance_Index ~ Sleep_Hours, data = Mydata)

Residuals:
    Min      1Q  Median      3Q     Max
-45.571 -15.026  -0.026  15.429  46.154

Coefficients:
            Estimate Std. Error t value Pr(>|t|)
(Intercept)  51.6657     0.7636  67.662  < 2e-16 ***
Sleep_Hours   0.5450     0.1132   4.816 1.49e-06 ***
---
Signif. codes:  0 '***' 0.001 '**' 0.01 '*' 0.05 '.' 0.1 ' ' 1

Residual standard error: 19.19 on 9998 degrees of freedom
Multiple R-squared:  0.002314,  Adjusted R-squared:  0.002214
F-statistic: 23.19 on 1 and 9998 DF,  p-value: 1.489e-06
Estimates:
For each additional hour of sleep, the student’s performance index increased by 0.54 on average. This result was statistically significant.
Coefficient of determination:
The model explains only 0.23% of the variability in the Performance_Index from the hours of sleep.
B. Multiple regression
Performance_lm <- lm(Performance_Index ~ Hours_Studied + Previous_Scores + Sample_Question_Papers_Practiced + Sleep_Hours, data = Mydata)
summary(Performance_lm)
Call:
lm(formula = Performance_Index ~ Hours_Studied + Previous_Scores +
    Sample_Question_Papers_Practiced + Sleep_Hours, data = Mydata)

Residuals:
    Min      1Q  Median      3Q     Max
-8.3299 -1.3831 -0.0062  1.3701  8.4864

Coefficients:
                                   Estimate Std. Error t value Pr(>|t|)
(Intercept)                      -33.763726   0.126841 -266.19   <2e-16 ***
Hours_Studied                      2.853429   0.007962  358.40   <2e-16 ***
Previous_Scores                    1.018584   0.001189  857.02   <2e-16 ***
Sample_Question_Papers_Practiced   0.195198   0.007189   27.15   <2e-16 ***
Sleep_Hours                        0.476333   0.012153   39.19   <2e-16 ***
---
Signif. codes:  0 '***' 0.001 '**' 0.01 '*' 0.05 '.' 0.1 ' ' 1

Residual standard error: 2.061 on 9995 degrees of freedom
Multiple R-squared:  0.9885,    Adjusted R-squared:  0.9885
F-statistic: 2.147e+05 on 4 and 9995 DF,  p-value: < 2.2e-16
B1. Interpretation
Estimates:
For each additional hour of study, the student’s performance index increased by 2.85 on average. This result was statistically significant.
For each additional point earned on past exams, the student’s performance index increased by one point on average. This result was statistically significant.
For each additional sample exam taken, the student’s performance index increased by 0.19 on average. This result was statistically significant.
For each additional hour of sleep, the student’s performance index increased by 0.47 on average. This result was statistically significant.
Coefficient of determination:
The model explains approximately 98.85% of the variability in the Performance_Index using the variables hours studied, previous scores, sample question papers practiced, and sleep hours. This means that, together, these four variables offer an extremely accurate prediction of academic performance, much stronger than when analyzed separately.
c. Regression Model Assumtions
c1. Lineality between dependent variables and independent variables
ggscatter(x="Hours_Studied", y="Performance_Index", data = Mydata, add="reg.line", add.params = list(color="red", fill="gray70"))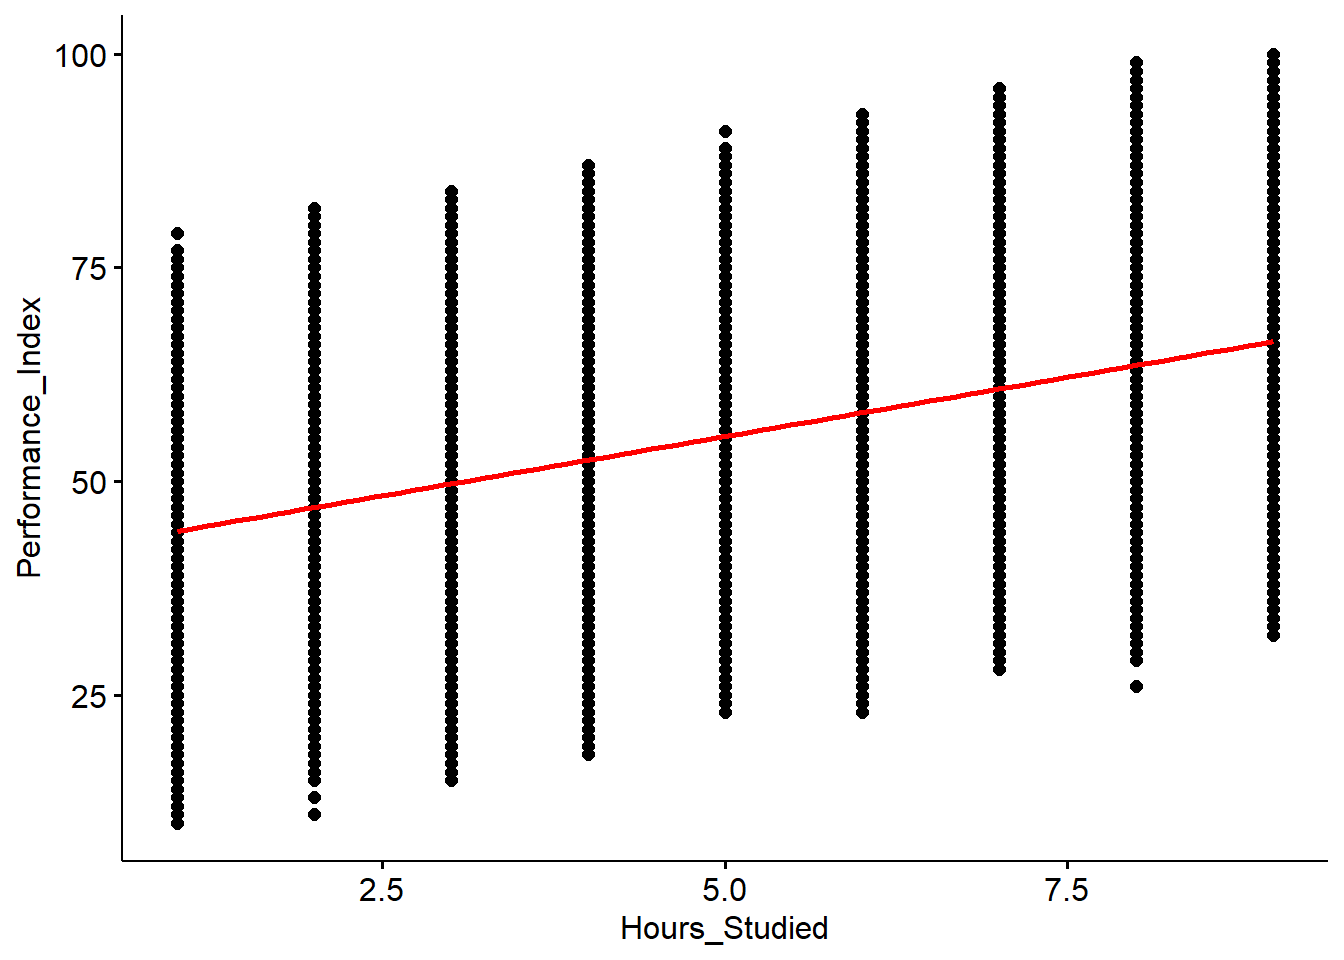
ggscatter(x="Previous_Scores", y="Performance_Index", data = Mydata, add="reg.line", add.params = list(color="red", fill="gray70"))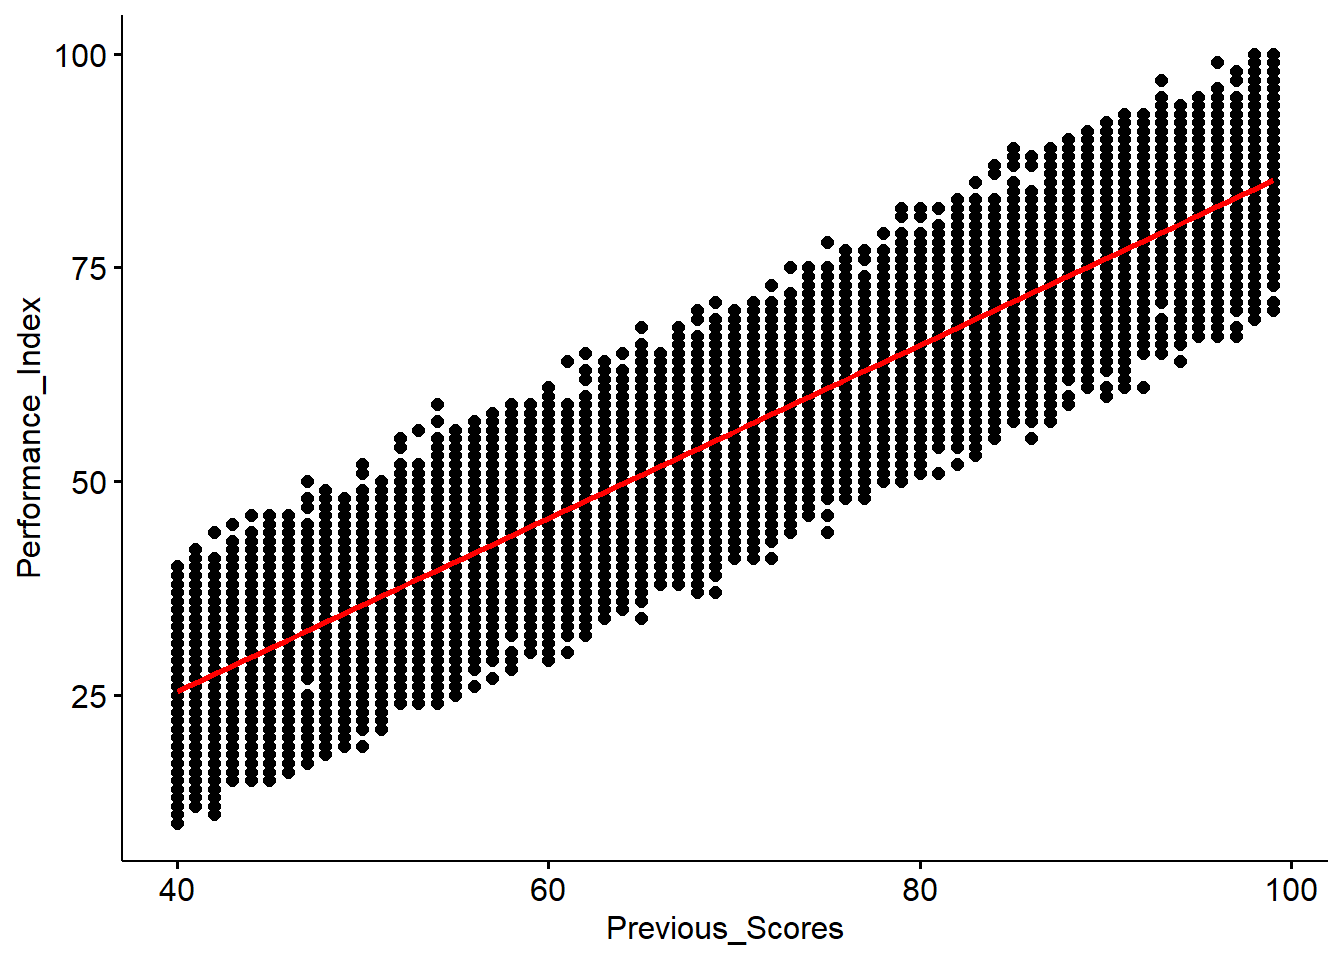
ggscatter(x="Sample_Question_Papers_Practiced", y="Performance_Index", data = Mydata, add="reg.line", add.params = list(color="red", fill="gray70"))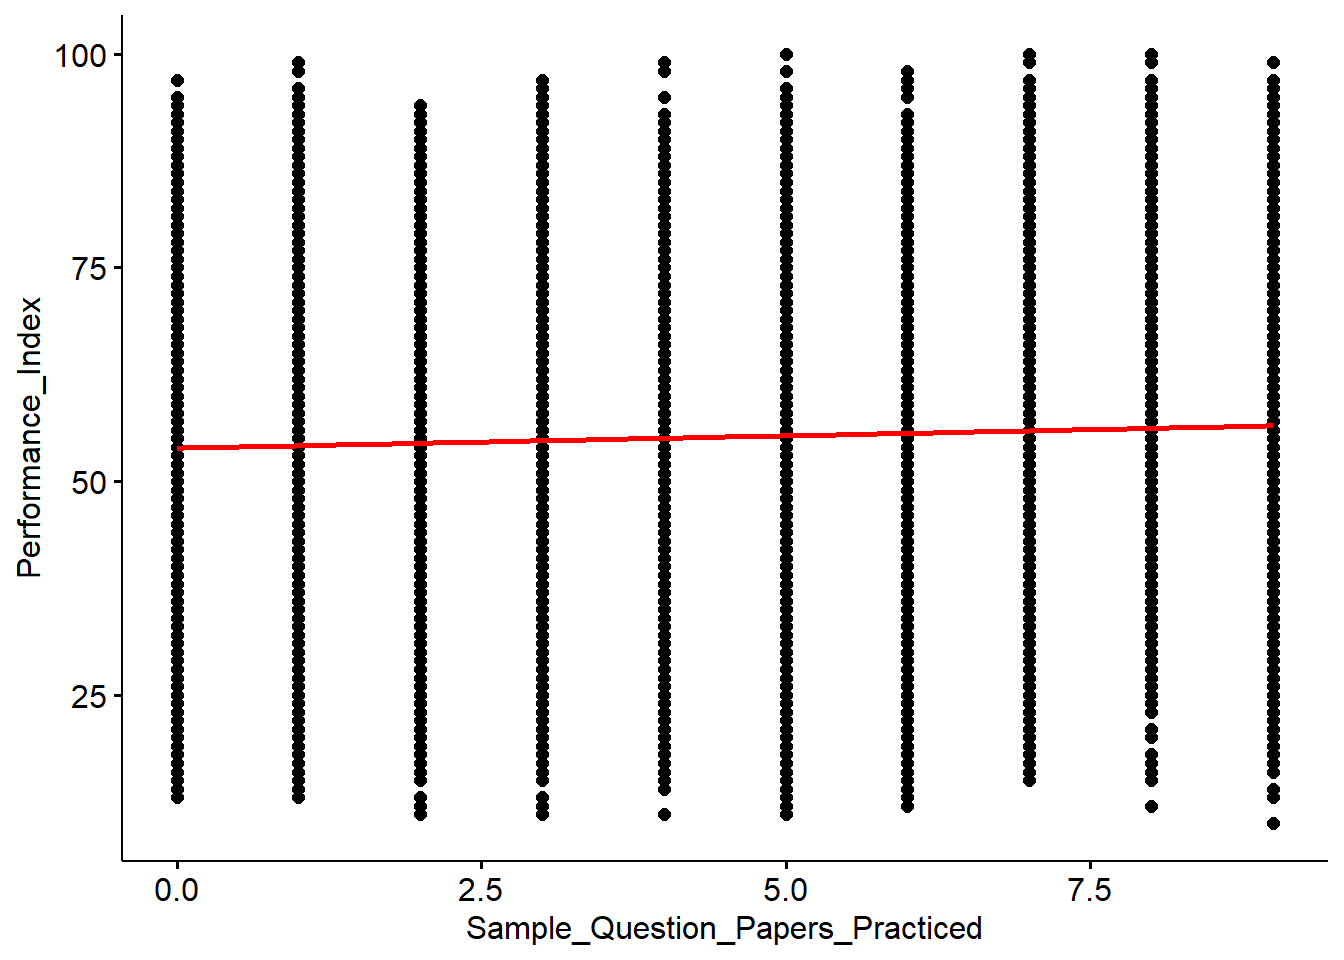
ggscatter(x="Sleep_Hours", y="Performance_Index", data = Mydata, add="reg.line", add.params = list(color="red", fill="gray70"))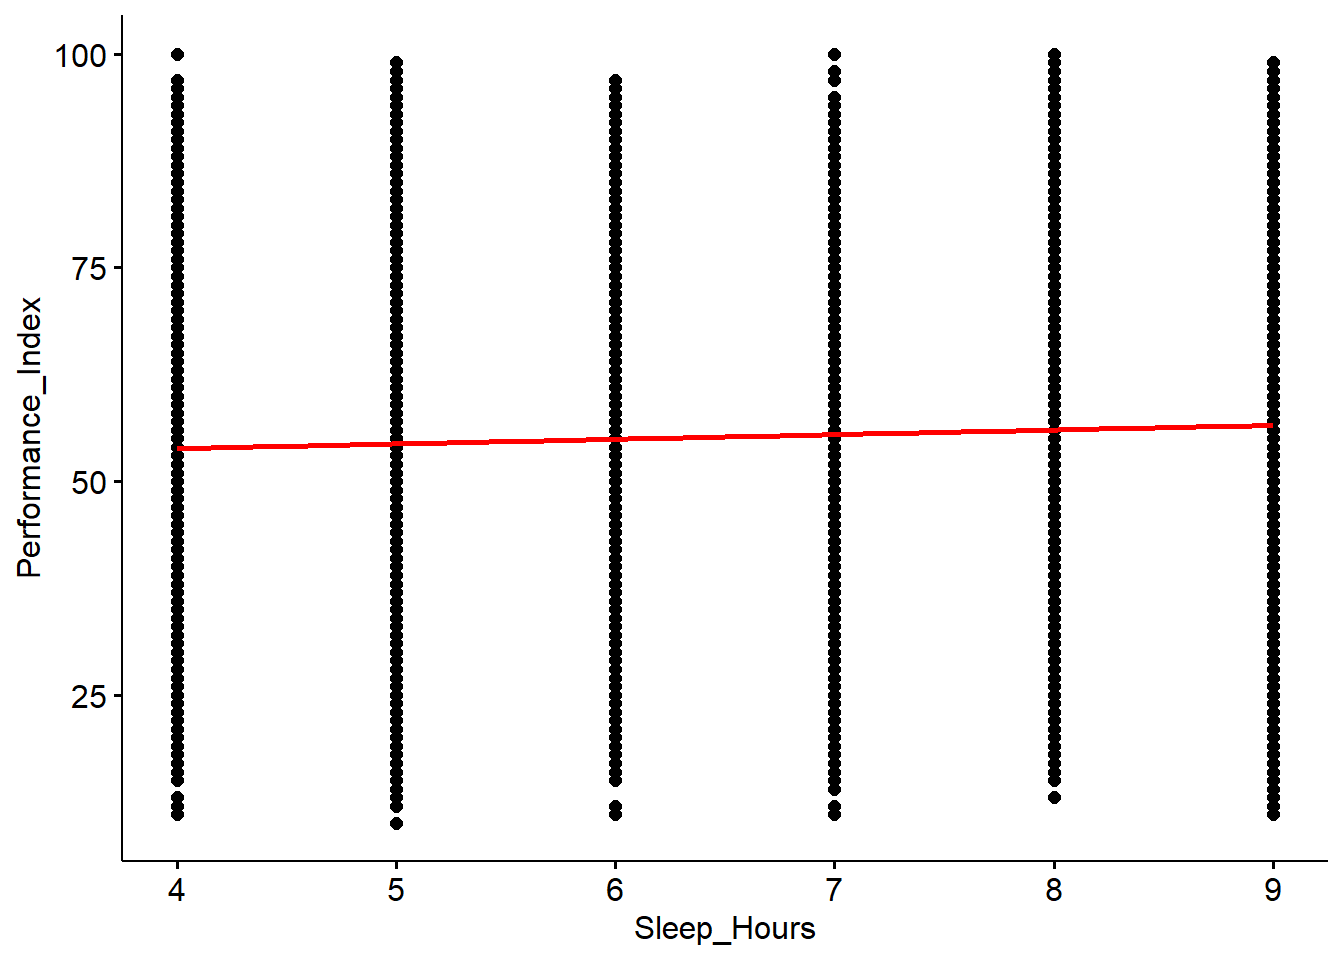
c2. Independence of observations
The observation from our model are independent.
This was fulfilled when each observation was made by one participant.
B3. Homocedasticity
The errors from our model have equal variance.
par(mfrow=c(2,2))
plot(Performance_lm)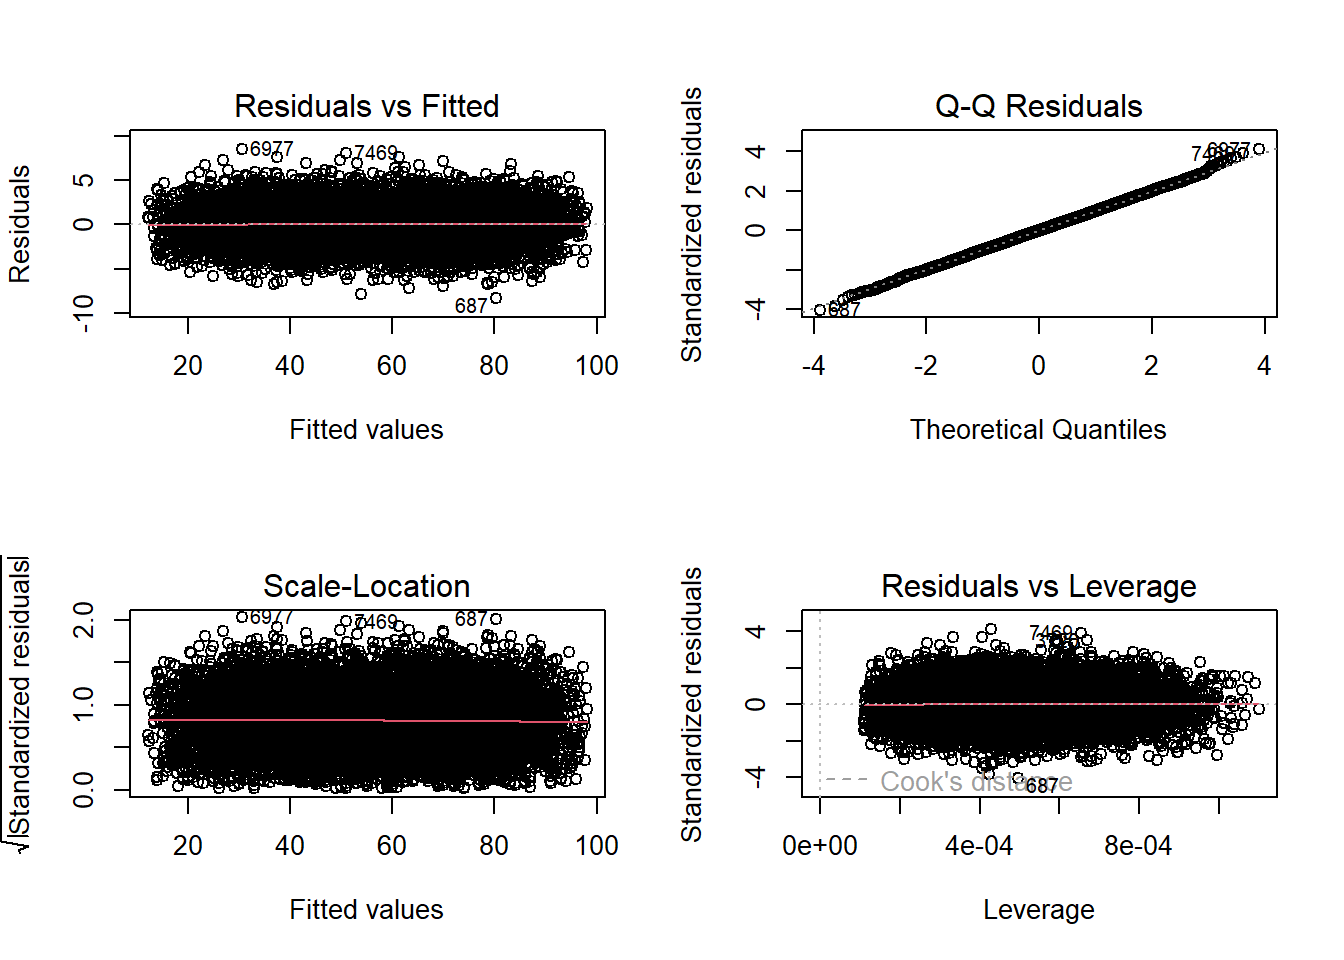
par(mfrow=c(1,1))c4. Normality of Errors
The errors from our model are normally distributed.
par(mfrow=c(2,2))
plot(Performance_lm)
par(mfrow=c(1,1))c5. Multicollinality: evaluate if the IVs are redundant.
vif(Performance_lm) Hours_Studied Previous_Scores
1.000464 1.000254
Sample_Question_Papers_Practiced Sleep_Hours
1.000386 1.000052